The past year capped yet another relatively subdued year for tech IPOs, with activity still well below 2013/2014 levels despite favorable market conditions.
In our view, the underlying reasons for the ongoing public offering torpor remain consistent with prior years: an abundance of capital (and high valuations) in private markets, the high costs of becoming—and remaining—a public company, analyst scrutiny, and an increase in liquidity alternatives. We believe these factors may continue to weigh on IPO volume in the year ahead.
Will 2018 Be More of the Same?
Nevertheless, we believe 2018 could shape up to at least match 2017’s IPO pace (market conditions permitting), with a little over 20 startups ready to join the public ranks. Our projection is based on a bottom-up analysis, starting with a list of over 200 of the largest VC-backed companies. We then use a combination of quantitative and qualitative factors that have historically presaged an S-1 filing to determine IPO readiness.
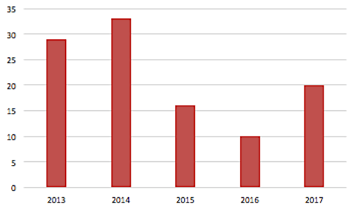
Number of Venture Backed IPOs Since 2013
Source: Company data, EquityZen estimates
The Profile of a Successful Tech IPO
History can serve as a valuable guide for determining which companies are primed for public debuts. We crunched the numbers on over 100 venture-backed companies that have completed an IPO since 2013 to gauge what the “average” tech IPO looks like. Our data set excludes biotech, life sciences, companies with a market capitalization below $50 million (many of which are shell companies for which sufficient data is not available) as well as Alibaba’s monstrous $21.8 billion IPO, which skews results meaningfully.
Based on our results, we believe the following characteristics are useful guideposts for evaluating IPO prospects:
- Age. At the time of IPO, the average venture-backed company from our data set has been private for approximately 11 years. With few exceptions, we consider 7-8 years as the minimum acceptable operating tenure for IPO candidates.

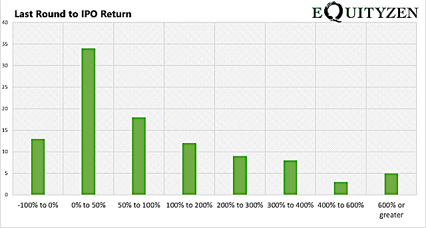
- Most Recent Round of Funding. At our average company's IPO, their most recent round of private fundraising was $106 million. Returns to investors are increasingly coming from the private market, as investors who gain access to these companies even in the final round of fundraising stand to see very solid gains. We note that the total return for investors in the last private round to the IPO price was – on average – an outsized 180%.
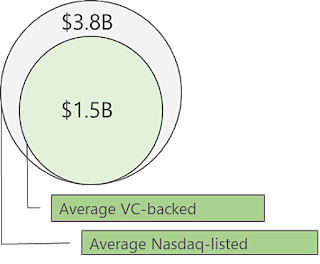
- Valuation and Revenue. The average size of the public offering was approximately $207 million, translating to an equity market cap of $1.45 billion at the opening bell (formerly private shareholders were diluted by about a fifth, on average). Annual revenues average $267 million in our dataset; we believe revenues should exceed $100 million at the very least to make a public offering viable.
- Less Quantitative Factors. While not explicitly measured by our data set, we believe the following factors can also be important for IPO readiness:
- C-Suite Experience: Companies that successfully complete IPOs tend to have c-suite executives experienced in the offering process, particularly in the CFO seat.
- Industry sentiment: IPO windows are heavily dependent on investor sentiment on a particular sector. Companies may delay an IPO if negative industry sentiment would weigh on valuation (and thus offering proceeds).
- Corporate culture: Public market investors are unlikely to feel confident investing in companies dealing with loss of management confidence, key employee exodus or regulatory investigations.
And The Nominees Are…
With the above criteria in mind, we list startups we view as S-1 ready below. While we have listed three companies below, check out our report on the full listing of all 22 companies on our radar. Note that all valuations below are as of the company’s last funding round.
|
 |
|
|
|
|