- Filter by:
- All
- Company News
- Education
- Insights
- Investors
- Shareholders
Looking back on Q1, the broader macro environment showed some mixed trends. While equity markets continued to soar and...
As more private companies make the news by announcing their plans to go public, more eyes are on the IPO market. After...

Getting in early as an investor in a promising company has the potential to drive substantial returns. Pre-initial...

Startup employees often begin their journey to liquidity by exercising stock options. This is an exciting step but also...

With both Astera Labs and Reddit off to great success in the public markets, now might be the time for more private...
Reddit's decision to allocate IPO shares to "super users" paid off after its first few days of trading, but will it be...

It was an exciting afternoon awaiting RDDT to hit the tape. Catch more from our Head of Market Insight, Brianne Lynch's...

A recent study by KKR highlighted that family offices, wealth management advisory firms for the very wealthy, are now,...
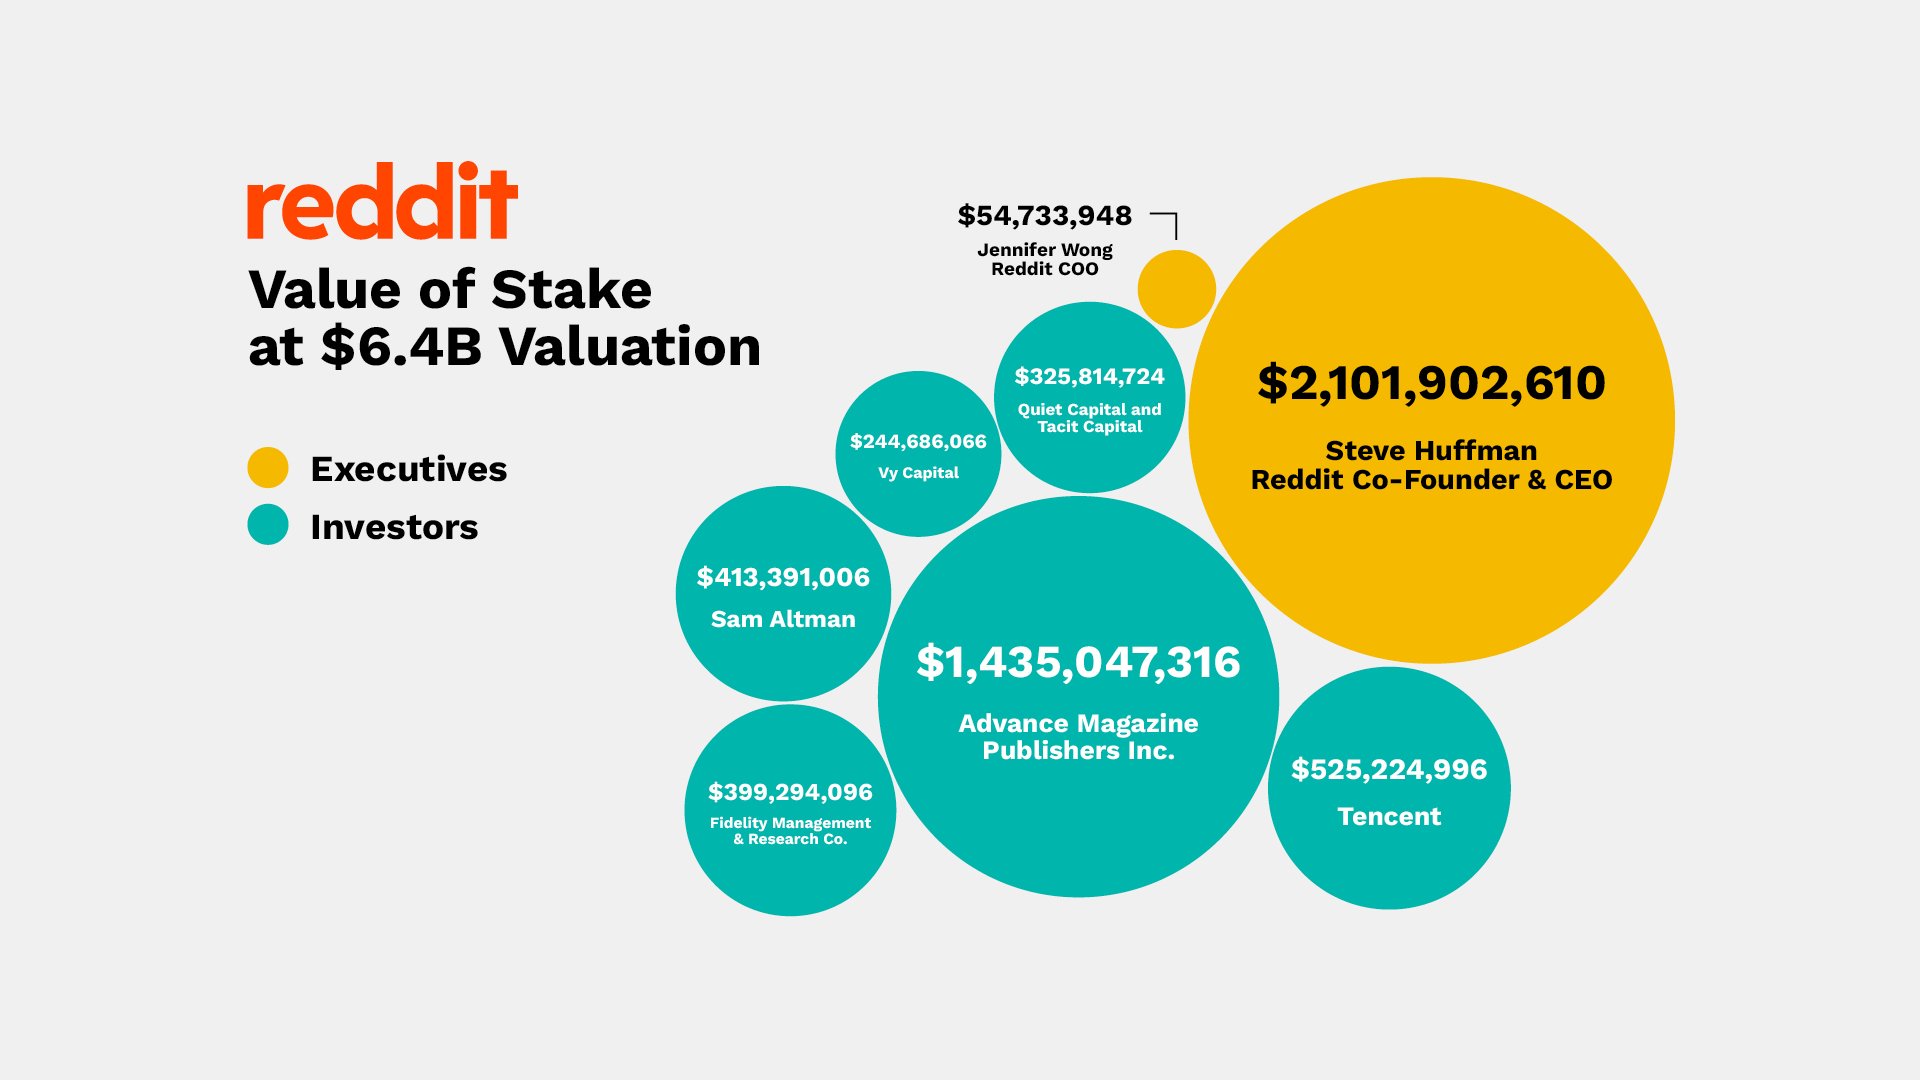
Reddit aims to raise around $750M in its highly anticipated IPO slated for a NYSE debut next week. So how much do...
